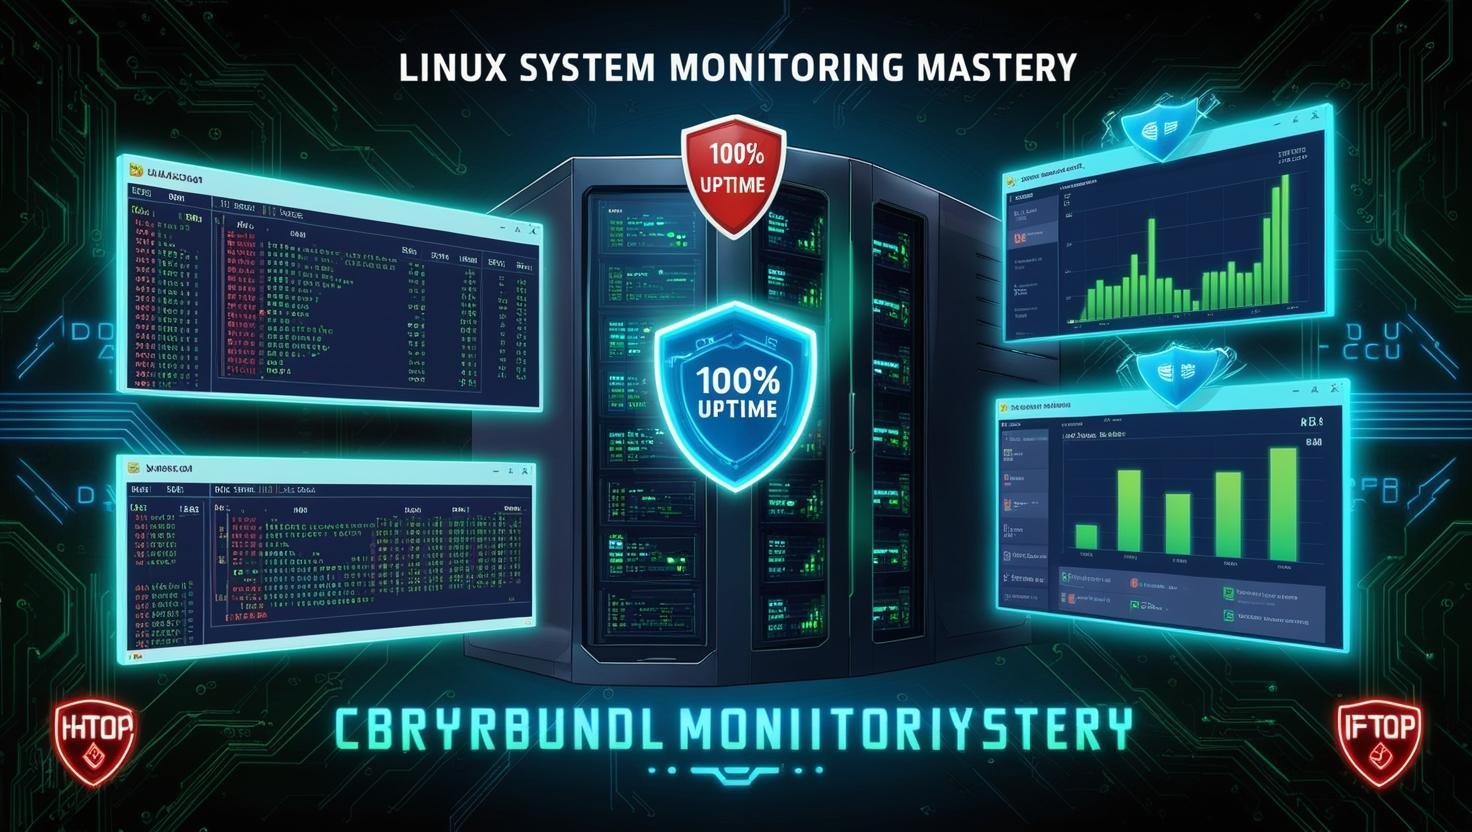
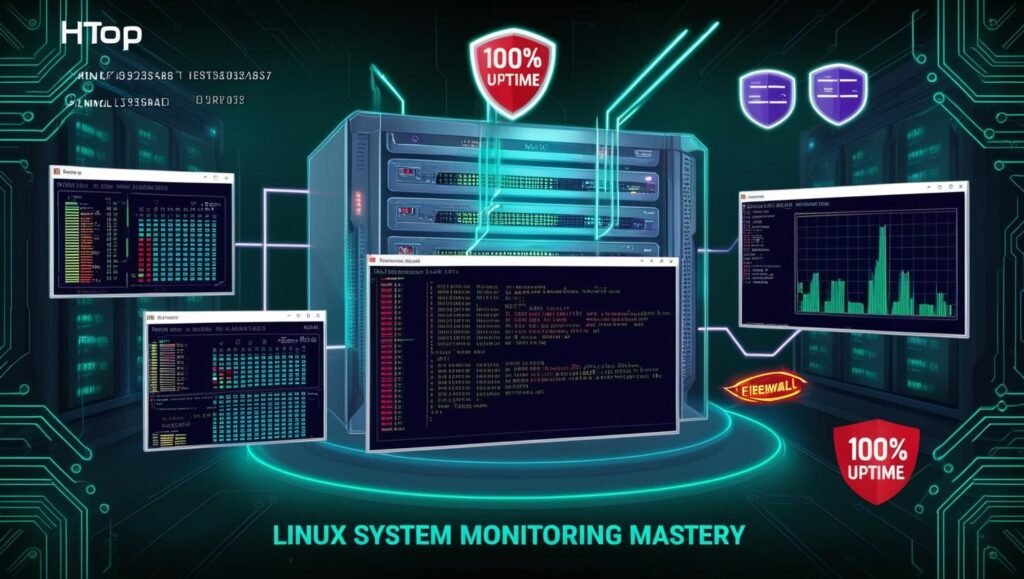
System Monitoring Tools for Linux: From netstat to glances
Introduction
Monitoring system performance is crucial for optimizing resource usage, troubleshooting issues, and ensuring server stability. Linux offers a wide range of monitoring tools—from basic command-line utilities like netstat and top to advanced real-time dashboards like glances and Prometheus.
In this guide, we’ll explore:
✔ Network monitoring tools (netstat, ss, iftop)
✔ Process & resource monitors (top, htop, atop)
✔ Disk & I/O analyzers (iotop, df, du)
✔ All-in-one dashboards (glances, bpytop, nmon)
✔ Enterprise-grade solutions (Grafana, Prometheus, Zabbix)
Let’s dive in!
1. Network Monitoring Tools
A. netstat (Legacy Tool)
Purpose: Check open ports, connections, and routing tables.
Installation:
bash
sudo apt install net-tools  # Debian/Ubuntu
sudo yum install net-tools  # RHEL/CentOS
Common Commands:
bash
netstat -tuln            # List listening ports
netstat -anp | grep ssh  # Find processes using SSH
netstat -r               # Show routing table
Limitations: Deprecated in favor of ss.
B. ss (Socket Statistics – Modern Replacement for netstat)
Purpose: Faster and more detailed than netstat.
Usage:
bash
ss -tulnp                # All listening ports
ss -s                    # Summary of connections
ss -lt                   # List TCP sockets
Advantages:
✔ Faster than netstat
✔ Shows more detailed socket info
C. iftop (Real-Time Bandwidth Monitoring)
Purpose: Monitor live network traffic by connection.
Installation:
bash
sudo apt install iftop    # Debian/Ubuntu
sudo yum install iftop    # RHEL/CentOS
Usage:
bash
sudo iftop -i eth0 # Monitor specific interface
Output:
- Shows top talkers (IPs using most bandwidth)
- Displays upload/download rates in real-time
2. Process & Resource Monitors
A. top (Basic Process Viewer)
Purpose: Real-time CPU, memory, and process tracking.
Usage:
bash
top
Key Shortcuts:
M→ Sort by memory usageP→ Sort by CPU usageq→ Quit
Limitations: No mouse support, limited features.
B. htop (Enhanced top Alternative)
Purpose: Interactive color-coded process manager.
Installation:
bash
sudo apt install htop     # Debian/Ubuntu
sudo yum install htop     # RHEL/CentOS
Features:
✔ Tree view of processes
✔ Mouse-friendly interface
✔ Kill processes directly
Usage:
bash
htop
C. atop (Advanced System & Process Monitor)
Purpose: Logs historical system performance data.
Installation:
bash
sudo apt install atop # Debian/Ubuntu
Usage:
bash
atop
Key Features:
- Tracks CPU, memory, disk, and network over time
- Helps diagnose past performance issues
3. Disk & I/O Monitoring
A. df (Disk Space Usage)
Purpose: Check filesystem disk space.
Usage:
bash
df -h                    # Human-readable format
df -i                    # Show inode usage
B. du (Directory Space Usage)
Purpose: Find which directories consume the most space.
Usage:
bash
du -sh /var/*            # Check /var/ subdirectories
du -h --max-depth=1 /    # Top-level directories
C. iotop (Real-Time Disk I/O Monitoring)
Purpose: Identify processes causing high disk I/O.
Installation:
bash
sudo apt install iotop # Debian/Ubuntu
Usage:
bash
sudo iotop -o # Show only active I/O
4. All-in-One Dashboards
A. glances (Comprehensive System Monitor)
Purpose: Single-pane view of CPU, RAM, disk, network, and processes.
Installation:
bash
sudo apt install glances # Debian/Ubuntu
Usage:
bash
glances
Features:
✔ Web UI (glances -w)
✔ Alert thresholds
✔ Docker container stats
B. bpytop (Python-Based htop Alternative)
Purpose: Fancy resource monitor with graphs.
Installation:
bash
pip install bpytop
Features:
✔ GPU monitoring
✔ Customizable themes
5. Enterprise Monitoring Solutions
A. Prometheus + Grafana
- Prometheus collects metrics.
- Grafana visualizes them in dashboards.
Use Case: Long-term monitoring & alerting.
B. Zabbix
Purpose: Full-stack monitoring (servers, networks, apps).
Features:
✔ Auto-discovery of devices
✔ Alerting & reporting
Conclusion
For Quick Checks:
htop→ Processesglances→ All-in-oneiftop→ Network
For Deep Analysis:
atop→ Historical dataPrometheus+Grafana→ Enterprise monitoring
Next Steps:
- Set up automated alerts (e.g., high CPU usage).
- Explore log monitoring (
journalctl,ELK Stack).
By mastering these tools, you’ll optimize performance and catch issues before they escalate!